
CPI Exceeds Expectations Across the Board, Analysts Warn BTC Faces Critical Test at $70,000
 BTC
Bitcoin Drops Below 74k: What Lies Ahead?
Author: Curry, TechFlow
TechFlow Digest:
Prompted by the latest US CPI inflation data exceeding expectations, rate cut expectations were severely dampened, causing the entire crypto market to come under pressure and sell off sharply. Bitcoin lost the key psychological level of $74,000, dropping more than 3% intraday and triggering over $180 million in long liquidations across the network within hours. Analysts at multiple institutions have warned that short-term support has retreated to around $73,000. If longs fail to halt the bleeding, Bitcoin will likely dip further to test the high-volume support zone at $70,000. This indicates that the easing premium previously built on rate cut speculation is being quickly erased by the market, while capital chasing rallies at elevated prices now faces direct pressure from leverage liquidation.
The shadow of inflation once again looms over Wall Street, and the liquidity premium for risk assets is being rapidly tightened.
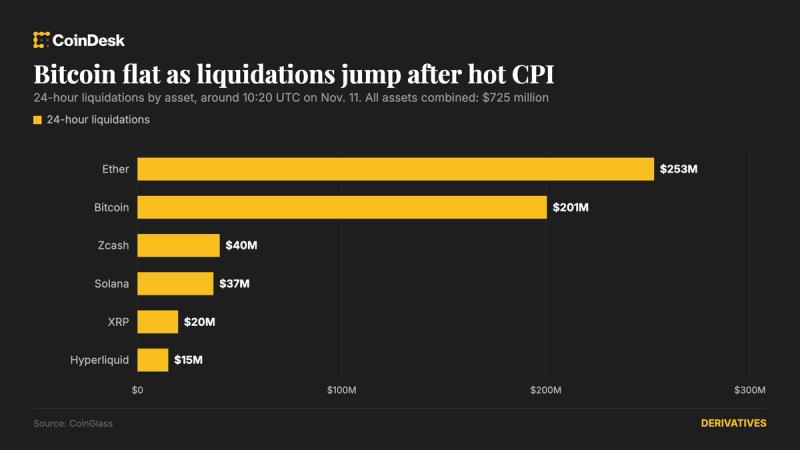
According to The Block, following the release of higher-than-expected US CPI inflation data, Bitcoin rapidly declined from its intraday high, breaching two major round-number defense lines at $75,000 and $74,000, before bottoming out near $73,200. Derivatives markets subsequently experienced a wave of long liquidations. Data monitored by Coinglass shows that total crypto asset liquidations across the network reached $184 million over the past four hours, with long positions accounting for over 82% of the total.
The sudden shift in macro sentiment was the direct catalyst for this sharp sell-off. Previously, Bitcoin had maintained a high-range consolidation amid institutional buying, but this resurgence in sticky inflation directly disrupted the market's expectations for continued Fed monetary easing. According to the CME FedWatch tool, following the data release, traders' pricing for a 25-basis-point rate cut by the Fed in December plummeted from 81% the previous day to 56%, significantly increasing the probability of a pause in cuts or the maintenance of higher rates for longer.
Core Inflation Unexpectedly Surges, Fed Rate Cut Expectations Hammered
The rebound in inflation data shattered prior expectations of stability.
Data released by the US Bureau of Labor Statistics shows that the October Consumer Price Index (CPI) increased 2.6% year-over-year, consistent with the rebound trend, though both month-over-month figures and core inflation exceeded market expectations, underscoring the stubborn resilience of services and housing costs. As reported by Bloomberg, the US Dollar Index (DXY) spiked nearly 40 points shortly after the data release, while the yield on 10-year US Treasuries rapidly approached a recent high of 4.45%.
Macro fund positioning is straightforward. Citing analyst perspectives, Reuters reported that when US Treasury yields remain robust at elevated levels, highly interest-rate-sensitive sectors like cryptocurrencies and growth tech stocks face immediate selling pressure, prompting capital to swiftly rotate into defensive assets.
Short-Term Break Below $74,000 Defense Line, $70,000 Becomes the Final Barrier for Longs
Following the breakdown below $74,000, the focal point of technical defense has been shifted significantly lower.
According to calculations by BRN Market Research analysts cited by The Block, the break below Bitcoin's previous high-level resistance-turned-support level marks a significant shift, leaving $73,000 as the first buffer zone. Should spot buyers fail to absorb selling pressure above $73,000, the path lower will widen further.
The greater test lies at the $70,000 mark. According to the latest market brief released by 10x Research, $70,000 is not only the historical high-volume consolidation zone from the previous breakout, but also a critical strike price for numerous institutional OTC options. Coinglass liquidation heatmaps similarly show that between $70,000 and $70,800, the market's largest concentration of leveraged long liquidation lines and passive buy orders are clustered.
Once $70,000 is breached, it will not only signify the complete structural breakdown of the breakout trend but also trigger a new wave of institutional stop-loss orders and liquidation cascades.
Derivatives High-Leverage Liquidation, Spot ETF Absorption Capacity Put to the Test
The catalyst for the broader market decline was deleveraging in the derivatives market.
Monitored by Glassnode, prior to the data release, Bitcoin open interest (OI) remained persistently in historical high ranges, while funding fees sustained annualized levels above 15% for consecutive days. This overheated leverage structure instantly became a target for liquidity harvesting as macro headwinds materialized.
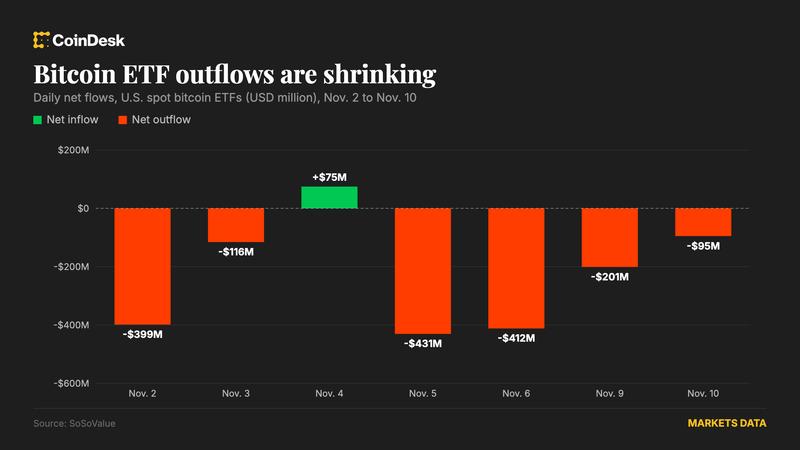
The absorption capacity of institutional buying becomes another key factor determining the subsequent trajectory. Statistics from SoSoValue indicate that recent inflow speeds into US spot Bitcoin ETFs have noticeably slowed compared to earlier peaks. Should spot ETF flows turn net negative amid inflation-driven headwinds, chain-native capital alone would struggle to quickly absorb the selling pressure.
For highly leveraged longs, this surprise inflation print has already executed a round of forced liquidations on their books; for spot holders, the next line of defense is clearly drawn at $70,000. This sharp sell-off currently serves as a recalibration of macro expectations, rather than the end of the bull market cycle.
Lue alkuperäinen lähteestä Techflowpost