Bitcoin is breaking a midterm election pattern going back to 2014
 BTC
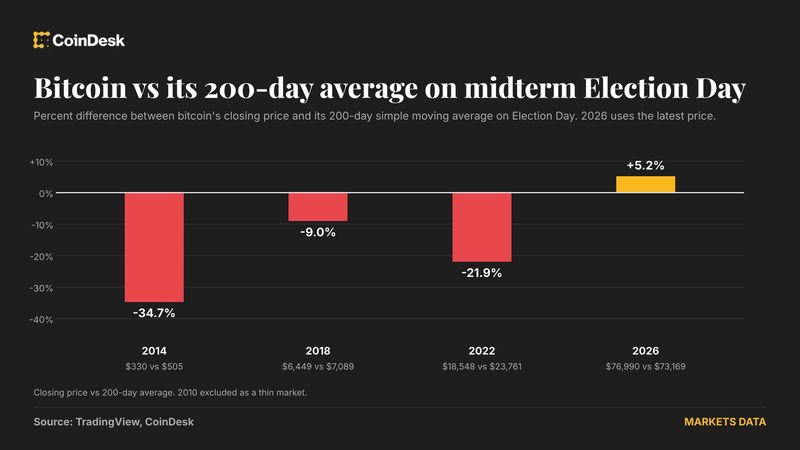
Bitcoin has gone into each of the last three US midterm elections licking its wounds. This time is different.
How? Look at where bitcoin’s price is relative to its 200-day average, a widely-tracked barometer of long-term market trends. As of this writing, BTC traded near $76,990, about 5.2% above its 200-day average of roughly $73,169. An asset trading above its 200-day average is said to be in a long-term bullish trend.
In 2014, 2018 and 2022, the situation on the midterm election day was the opposite, as bitcoin traded below the average, by about 35%, 9% and 22% respectively. These three years were bear market years, consistent with the four-year halving cycle, which sees bitcoin peak roughly 18 months after a halving and then drop into a year-long bear market.
2026 was supposed to be the same after BTC peaked above $126,000 in October last year. But this year’s bear market was both shallow and front-loaded, meaning much of the drop happened in January and February, which is why we are already above the 200-day SMA.
This bullish setup looks even more impressive when we consider past data, which shows BTC rallying significantly in the year after midterms. However, in the short run it trades choppily, according to DWF Labs.
“The first few months after a midterm have historically been choppy to slightly bearish for BTC, but it has been higher 12 months later every time. Cautious optimism is the approach we’re taking,” Martin Lee, research lead at DWF Labs, said in an email. “History favors BTC on a 12-month horizon, but expect near-term volatility, especially if the war escalates and the AI trade keeps weighing on risk assets.”
Besides, the outcome of the election itself could decide the market trend in the near term, along with other factors such as ETF flows and macro data like the U.S. jobs report due Friday and its impact on Fed interest rate expectations. Stay alert!
What’s trending
- Binance has spent half its SAFU bitcoin, about $580 million worth, data shows (CoinDesk): Binance has drained half the bitcoin from the emergency fund it built to protect users. The address Binance publishes as its Secure Asset Fund for Users (SAFU) wallet held just above 7,500 BTC.
- Bitcoin’s latest chart signal looks a lot like the ones before its big crashes (CoinDesk): Bitcoin’s chart is flashing a red signal, similar to the one seen before February and June price crashes. The signal comes from the Guppy Multiple Moving Average, an indicator widely tracked in markets for gauging near-term and long-term trends.
- Dollar drifts on Mideast, midterm risks; Aussie and yuan dip (Reuters): The dollar eased on Tuesday as investors weighed uncertainty over U.S.-Iran tensions and U.S. midterm elections, while the Australian dollar and China's yuan came under pressure after domestic policy moves. The euro rose to $1.1201, the pound to $1.3421 and the Japanese yen to 157.8 per dollar.
- Tech losses weigh on global markets ahead of US midterm elections, while oil prices rise (AP): World shares fell and U.S. futures also declined Tuesday as investors awaited the outcome of the U.S. midterm elections. Oil prices climbed after the U.S. attacked Iranian targets in the Strait of Hormuz.
Today’s signal
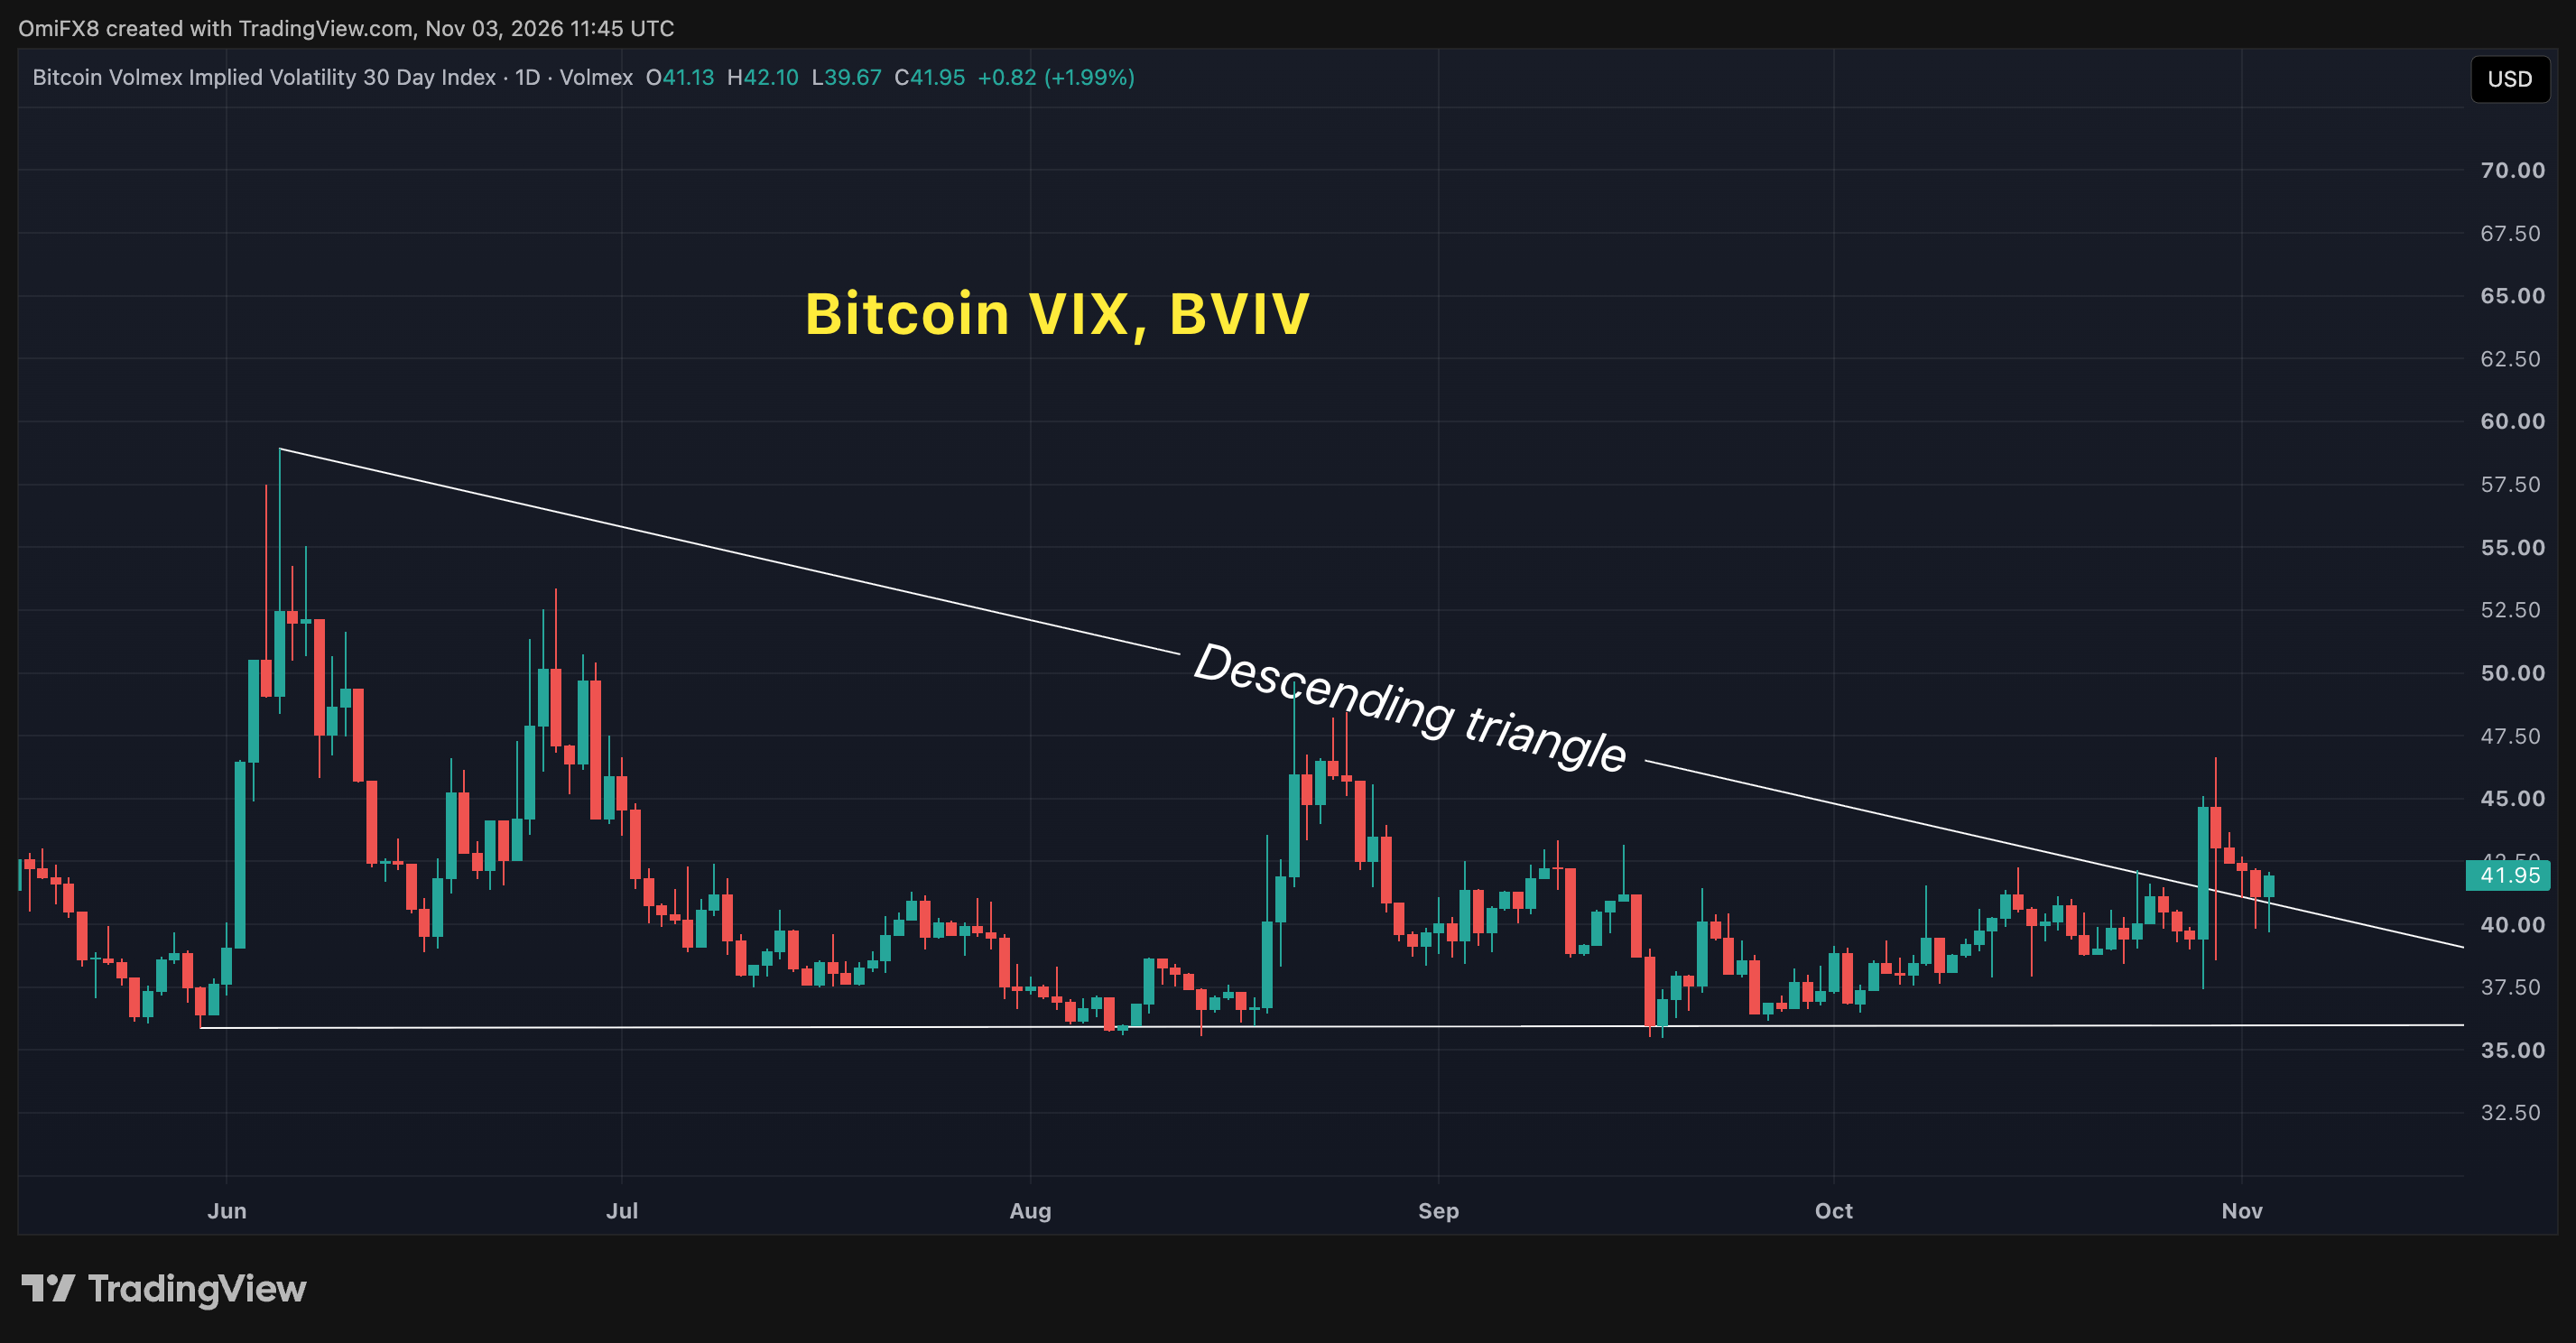
BTC VIX, BVIV. (TradingView)
The chart shows daily price action in Volmex’s Bitcoin 30-Day Implied Volatility Index (BVIV), often called the “Bitcoin VIX,” in candlestick format.
The index measures the volatility traders expect in bitcoin over the next 30 days.
BVIV recently broke out of a descending triangle, a technical analysis pattern said to signal a potential move higher.
The timing is notable: Several potential market-moving events are due this week, beginning with Tuesday’s U.S. midterm elections and ending with Friday’s nonfarm payrolls report.
More News