
Glassnode Weekly: Stablecoins Shrink at Fastest Pace in Four Years, Bitcoin Dips Due to Lack of 'Fuel' While Whales Quietly Accumulate
 BTC
Synchronized capital outflows across multiple channels, but recent leverage liquidation and whale accumulation are currently providing a floor for the market.
Author: Glassnode
Compiled by: TechFlow
TechFlow Summary: Bitcoin has recently dipped to around $74,000, breaking below the $75,600 Short-Term Holder Cost Basis and significantly underperforming the S&P 500 and Nasdaq amid the market rebound following the midterm elections. Over the past 30 days, total stablecoin supply contracted by $14.2 billion, marking the fastest shrinkage since June 2022.
Despite US spot ETFs turning to net outflows and significant pressure on Coinbase's negative premium, near-term long leverage in the market has been largely flushed out, and bid liquidity below the spot order book continues to outweigh asking liquidity above. The bullish structure established since August remains intact above the previous low of $58,500, with two major whale wallet groups having already resumed accumulation.
Core Summary
- Bitcoin has broken below the $75,600 Short-Term Holder Cost Basis and is underperforming US equities, while incremental capital that could drive price appreciation continues to flow out.
- Total stablecoin supply is contracting at its fastest pace since June 2022, US spot ETFs have turned to net redemptions, and Bitcoin is trading at a discount on Coinbase.
- Meanwhile, this pullback has largely flushed out near-current-price long leverage, buy-side depth on the order book exceeds sell-side, and two large wallet groups have already resumed accumulating.
- September's high marks the first higher high since the 2025 all-time high; as long as price holds above June's prior low of $58,500, this mid-term trend reversal structure remains valid.
Pressure on Recent Buyers' Unrealized Losses
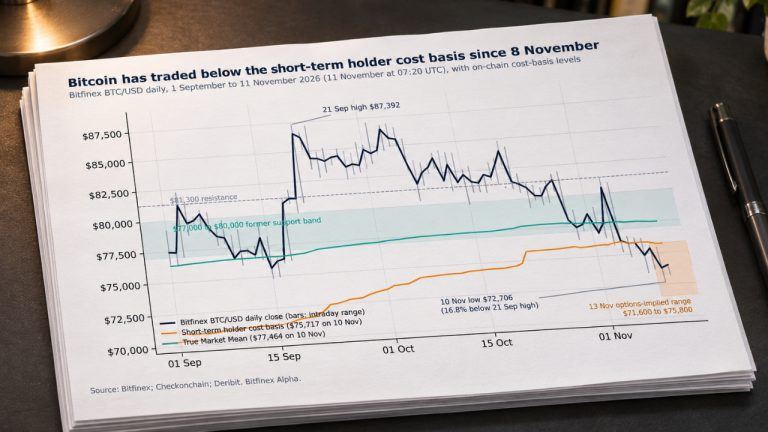
Last week, we identified the $73,000 to $76,000 range as a key observation zone. Bitcoin subsequently slipped into this area and traded around $74,000, currently sitting below the $75,600 Short-Term Holder Cost Basis, which represents the average entry price for investors who bought within the past 155 days.
At the peak in September, nearly all short-term holder positions were in profit. As of now, that ratio has dropped to approximately 35%, with recent sellers among short-term investors averaging a small loss.
The Cost Basis Distribution clearly reveals where these positions entered the market. Currently, about two-thirds of short-term holdings sit above the current price, clustered across three dense accumulation bands from purchases made between August and October, extending as high as $83,600.
Should the market rally, many of these trapped holders may look to break even and exit. Conversely, looking below the current price, the only dense support band lies between $62,000 and $66,000, primarily formed by bids around the August local lows.
Notably, the broader market structure initiated since August remains intact. September's high recorded the first elevated swing high since the 2025 historical peak, and the current price remains well above June's prior low of $58,500.
If the market can reclaim the True Market Mean at $77,500, roughly half of the short-term holder supply would return to profitable territory.
Underperformance vs. US Equities
Last week, we noted that most of Bitcoin's drawdown during the midterm elections was actually front-loaded before voting concluded. The subsequent new wave of selling beginning on November 5 simultaneously impacted both US equities and the Bitcoin market.
However, starting from November 9, their trajectories began to diverge. Both the S&P 500 and Nasdaq 100 have since reclaimed their election day closing levels, while Bitcoin slipped again after the November 10 CPI release, logging a cumulative decline of roughly 5% so far.
Bitcoin can only truly resume catching up with the equity recovery once price firmly breaks back above the election day closing price of $77,800.
Treasury Yields Reflect Additional Rate Hike Pricing
Interest rate outlooks continue to weigh on the market. The two-year US Treasury yield reflects traders' expectations for the Federal Reserve's policy rate average over the next two years. It currently sits at 4.75%, 75 basis points above the Fed's current benchmark rate of 4%, indicating that fixed income markets are pricing in the possibility of further rate hikes.
However, this is far removed from the severe tightening shock of 2022. In June 2022, the same spread spiked to 244 basis points; today's spread is only about a third of that level and has already narrowed since late October.
While a higher interest rate environment certainly remains a headwind for risk assets, bond markets are not betting on a repeat of the 2022 tightening crisis.
Accelerating Stablecoin Outflows
Stablecoins function as the cash reserves for the crypto market, representing the dollar capital parked on exchanges and on-chain that traders deploy before buying coins. Over the past 30 days, total network stablecoin supply plummeted by $14.2 billion, marking the fastest contraction since June 2022.
Sustained supply contraction implies holders are redeeming stablecoins into fiat dollars and withdrawing cash directly from the crypto ecosystem, depriving potential upside rallies of crucial "fuel".
Tether similarly reflects this outflow pressure, recently trading slightly below its $1 peg. Should the 30-day supply change flip from negative back to positive, it would serve as the first clear signal of fresh off-exchange capital returning.
Weakening US Market Demand
US spot Bitcoin ETFs have also turned to net redemptions. Over the past 20 trading sessions, these funds accumulated $1.6 billion in net outflows, breaching our $1.5 billion threshold used to define a "persistent outflow cycle" on November 9.
However, compared to historical ETF outflow cycles, the scale of this sell-off remains relatively shallow, with past outflow waves far deeper than the current one. Historically, ETF capital typically resumes net inflows only after Bitcoin forms a cyclical bottom, making inflow resumption a lagging confirmation signal.
Pronounced Negative Premium on Coinbase
The Coinbase Premium Index measures the price discrepancy between Bitcoin on Coinbase, the primary exchange for US investors, and the global blended price. We have excluded distortions caused by Tether trading slightly below its $1 peg to prevent visual exaggeration of the negative premium.
Looking at the 30-day moving average, the Coinbase premium has remained in negative territory throughout the decline from September's high, with the current discount depth reaching its lowest point since February of this year.
In every past bull cycle, aggressive US buyer accumulation drove the premium to stay positive, whereas current US buy-side participation is conspicuously absent. If this premium flips positive and sustains for several consecutive weeks, it would signal a genuine return of domestic US demand.
Leverage Sparse Near Current Price, Liquidations Concentrated Below
Liquidation heatmaps calculate the trigger zones where futures leverage positions face forced liquidations at various price levels. The positive aspect is that the steady decline since September's high has cleared most piled-up long liquidation levels along the way, as evidenced by the dark vacuum areas behind the candlesticks.
This significantly reduces the risk of a cascading liquidation stampede near the current price. On the six-month liquidation heatmap, the largest concentration lies much lower between $59,500 and $62,600, remaining untouched since the August low.
Conversely, the distribution between that dense zone and the current market price is very thin. Meanwhile, despite prices pulling back ~15% from September's high, global Open Interest has recovered to levels seen at that peak, suggesting many traders are adding to short positions on the downside.
If prices reverse sharply upward, these newly added shorts will be forced to cover; the largest current short liquidation cluster above the prevailing price sits near $87,500.
Greater Buy Depth Below Than Sell Pressure Above
Spot order books exhibit a similar asymmetric support structure favoring bulls. Since the selling wave on November 5, aggregate buy orders within the 5% range of the current price on both Binance and Coinbase have exceeded ask liquidity in every hourly interval.
The brackets beneath the heatmap highlight the areas of highest buy concentration, primarily clustered between $68,000 and $72,500. The upper bracket shows the opposite picture: beyond the ask wall tightly hugging the current price, the entire ask side of the order book up to roughly $84,000 is extremely sparse, corresponding to the dark vacuum band in the chart.
This implies that if price breaks upward, resistance originating directly from the order book will be limited, though it must still absorb the selling pressure from short-term holders waiting to break even. Notably, limit orders can be canceled at any time; indeed, some supporting buy walls were temporarily withdrawn and relisted during the sharp drop in early November.
Major Wallets Begin Accumulating
The Accumulation Trend Score tracks position changes across different wallet size cohorts (approaching 1 indicates active accumulation, approaching 0 indicates distribution), weighted by holding volume.
Over the past week, two wallet cohorts saw their scores rise above 0.5: wallets holding 100 to 1,000 BTC, and those holding 1,000 to 10,000 BTC. These two groups spent most of October in a distribution phase.
It is worth noting that both of these major wallet tiers briefly flipped to net buyers in late September, but the trend lacked follow-through. Aside from this, all other holding cohorts remain on the defensive, ranging from super-whales holding over 10,000 BTC down to retail wallets holding less than 1 BTC.
This indicates an early, speculative bottom-fishing attempt by a limited pool of capital. Full market buy-side recovery will only be confirmed when smaller and medium-sized holding groups join in.
Conclusion
Bitcoin is undergoing a correction in an environment lacking incremental capital support: recent buyers are broadly underwater, performance significantly lags US equities, and capital is synchronously draining across three key dimensions: stablecoins, US spot ETFs, and domestic US buy-side flows. Direct bullish catalysts in the immediate term are indeed scarce.
Conversely, futures long leverage around the current price has been effectively flushed, with two core whale cohorts being the first to step in and buy. For investors viewing August as the start of a major cyclical trend reversal, this is a critical window where the market is brewing for mean reversion.
A successful reclaim of the $75,600 Short-Term Holder Cost Basis would strongly validate this bullish bias. Conversely, a sustained breakdown below last week's watch floor of $73,000 suggests prolonged consolidation; a decisive daily close below June's prior low of $58,500 would completely invalidate the reversal trend established in August.
Data cutoff: Price and derivatives data as of 11:00 UTC on November 11, 2026; spot order book data as of 09:00; ETF flows, stablecoin supply, cost basis, and accumulation trend score statistics are updated through November 9.
Disclaimer: This report does not constitute investment advice. All data is provided solely for informational reference and research education. Investment decisions should not be directly based on this content; readers bear full independent responsibility for their trading activities.
Exchange balance data referenced herein is calculated using Glassnode's address tagging database, which combines official disclosures with proprietary clustering algorithms. While we strive for rigorous accuracy, relevant statistics may not encompass full reserves in cases where exchanges do not publicly disclose official addresses.
Users should exercise caution and independent judgment when utilizing the aforementioned on-chain metrics. Glassnode assumes no liability for differences in statistical methodologies or potential discrepancies.
Prečítajte si pôvodný článok na Techflowpost